COVID-19 Infection Rate
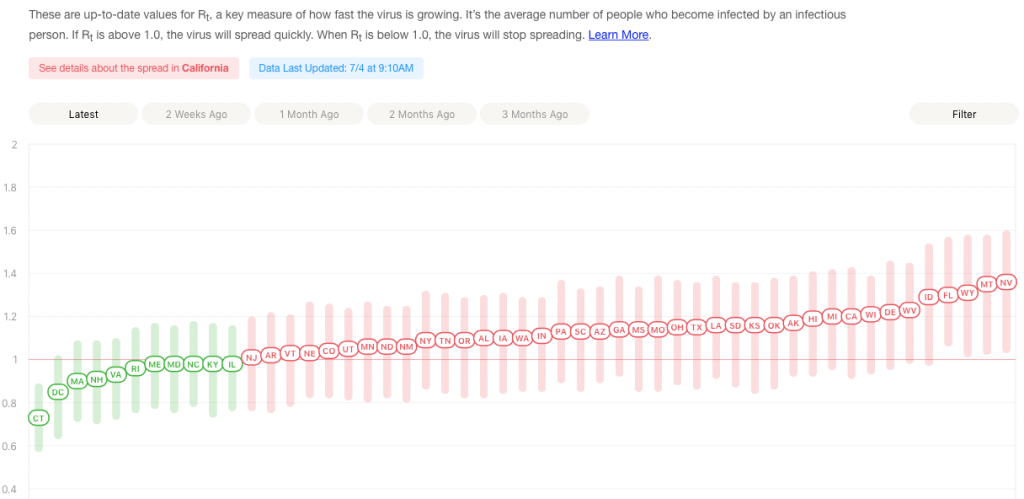
The site Rt.live is a tracker of how fast COVID-19 is spreading in each state updated daily. You can compare the current rates to yesterday, last week, 2, 3, and 4 weeks ago. The site also displays the Rt rate per state over time. I have not found another site that is looking at COVID-19 this way.
Unfortunately, The rate of transmission after going down almost everywhere – which is shown in the April 22, 202 snapshot – has now reversed and it is not looking good.
The site was created by Instagram founders Kevin Systrom and Mike Krieger, who have teamed up to launch their first product together since leaving Facebook. They (and their team) have developed an interesting statistical model. You need more than a basic understanding of statistics and programming to really understand how they have built their model. I’m not 100% in agreement with their model, but I haven’t been able to come up with an improvement.
Rt is the effective reproduction rate of the virus calculated for each locale. It lets us estimate how many secondary infections are likely to occur from a single infection in a specific area. Values over 1.0 mean we should expect more cases in that area, values under 1.0 mean we should expect fewer. You can download how they estimate Rt. They even share the code they wrote to manipulate the data.
The site is at https://rt.live
July 4, 2020 Chart
39 states with increasing infection rates.

July 4, 2020
April 22, 2020 Chart
17 states with increasing infection rates.


Pingback:COVID-19 Information – Michael William Hughes